|
|
|
ANNUAL REPORT 2009
CHAPTER III
THE PETITION AND CASE SYSTEM STATISTICS (Continuation)
g. Total number of cases and petitions pending to December 31,
2009
This graph includes the total number of cases and petitions pending before the Commission and their breakdown by OAS Member State in descending order by country.
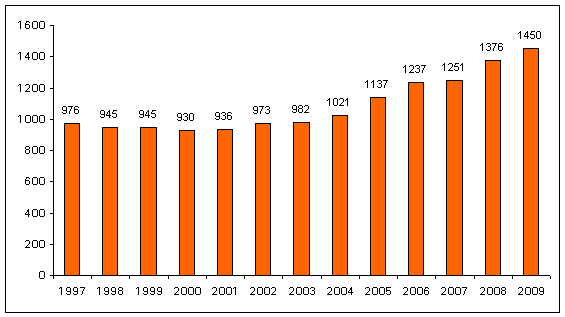
h. Total number of cases and petitions being processed by year.
The preceding graph shows a comparison of the number of cases and petitions pending over the past thirteen years.
2. Precautionary measures
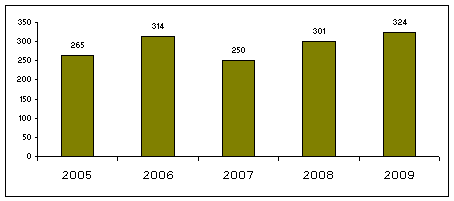
a. Total number of precautionary measures requests received by year.
b. Total number of precautionary measures granted by country during 2009
This graph includes the total number of precautionary measures granted by country during the year 2009.
The preceding graph shows the total number and variation in the figure corresponding to precautionary measures granted by the IACHR in the past ten years. The number of precautionary measures granted does not necessarily reflect the number of persons protected when measures are adopted, since, on many occasions, several persons or entire communities receive protection.
[Table of Contents | Previous | Next] |


